


🌡️ What Is Temperature Anomaly? Why Geographers Look Beyond Just Temperature
When we open a weather app, we usually see numbers such as:
🌞 Today: 35°C
🌦️ Tomorrow: 34°C
Many people may think this is enough to say, “Today is hot.”
But for geographers, climatologists, and climate scientists, the more important question is:
“How much hotter than normal is today?”
The answer is Temperature Anomaly, one of the most important indicators used to study climate change.
🌍 What Is Temperature Anomaly?
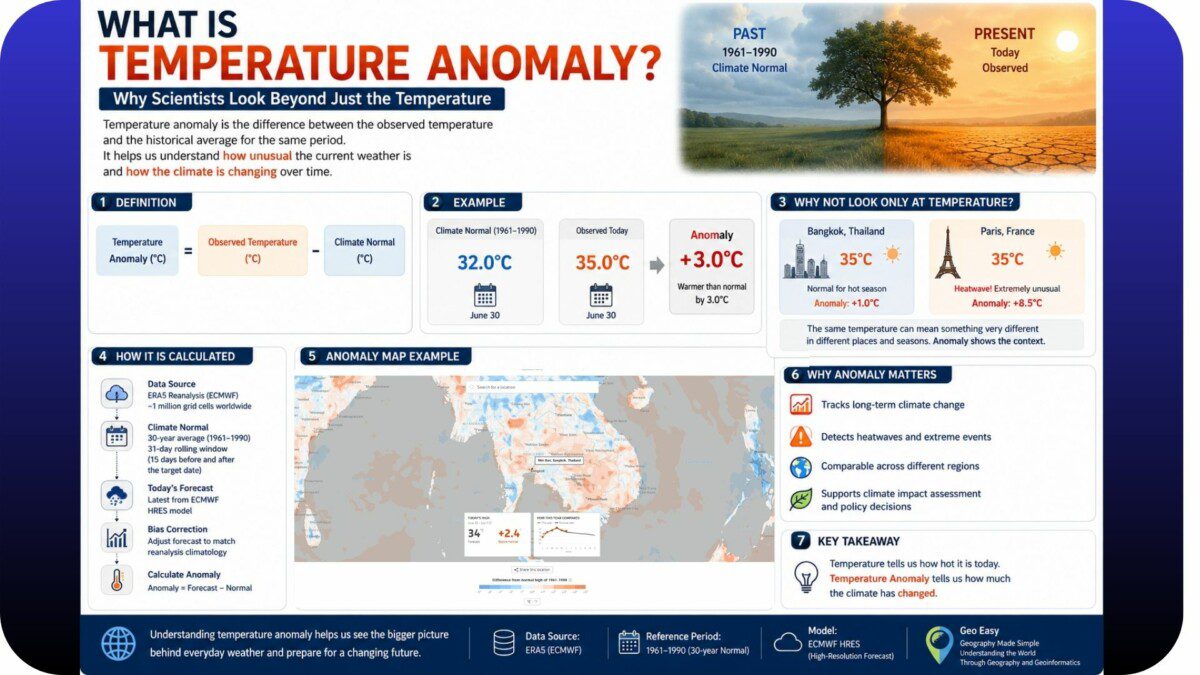
Temperature Anomaly is the difference between the temperature observed today and the long-term average temperature for the same period in the past, known as the Climate Normal.
Scientists do not only ask:
What is today’s temperature?
They ask:
Is today warmer or cooler than normal, and by how many degrees?
For example:
- Historical average high temperature on June 30 = 32°C
- Observed high temperature today = 35°C
Therefore:
35°C − 32°C = +3°C
This means today is 3°C warmer than the historical normal.
📊 Why Not Look Only at Temperature?
Temperature alone can be misleading because each place has a different climate background.
For example:
- Bangkok at 35°C during the hot season may be normal.
- A European city at 35°C may indicate an extreme heatwave.
That is why comparing today’s temperature with the local normal provides a better understanding of how unusual the weather is.
🛰️ What Is Climate Normal?
Climate Normal is a long-term average of climate data, commonly calculated over a 30-year period.
This helps reduce short-term weather variability and provides a baseline for understanding the typical climate of each region.
For example, Reuters Climate Monitor uses ERA5 Reanalysis data and compares current temperatures with the 1961–1990 climate normal.
🗺️ Temperature Anomaly and Geographic Maps
In GIS and climate mapping, Temperature Anomaly can be calculated for each grid cell and displayed as a color map.
In general:
🔴 Red = warmer than normal
🔵 Blue = cooler than normal
This allows scientists and the public to see climate patterns across regions and continents more clearly.
🌏 Why Does Temperature Anomaly Matter?
Temperature Anomaly is important because it allows fair comparison between regions with different climate backgrounds.
It helps us:
- Track global warming trends
- Detect heatwaves and extreme events
- Assess climate change impacts
- Compare climate conditions across regions
🎯 Conclusion
Daily temperature tells us how hot it is today.
But Temperature Anomaly tells us how much today differs from what used to be normal.
That is why geographers and climate scientists focus on Temperature Anomaly, because it reveals not only today’s weather, but also how the climate system is changing over time.
Temperature tells us how hot it is today. Temperature Anomaly tells us how much the world has changed.
Geo Easy : Geography Made Simple
Understanding the World Through Geography and Geoinformatics
━━━━━━━━━━━━━━
🌡️ Temperature Anomaly คืออะไร? ทำไมนักภูมิศาสตร์จึงไม่ดูแค่อุณหภูมิ
เวลาเปิดแอปพยากรณ์อากาศ เรามักเห็นตัวเลข เช่น
🌞 วันนี้ 35°C
🌦️ พรุ่งนี้ 34°C
หลายคนอาจคิดว่าเพียงเท่านี้ก็เพียงพอสำหรับการบอกว่า “วันนี้ร้อน”
แต่สำหรับนักภูมิศาสตร์ นักภูมิอากาศวิทยา และนักวิทยาศาสตร์ด้านสภาพภูมิอากาศ คำถามที่สำคัญกว่าคือ
“วันนี้ร้อนกว่าปกติเท่าไร?”
คำตอบของคำถามนี้คือ Temperature Anomaly หรือ ค่าความเบี่ยงเบนของอุณหภูมิ ซึ่งเป็นหนึ่งในตัวชี้วัดสำคัญในการศึกษาการเปลี่ยนแปลงสภาพภูมิอากาศ
🌍 Temperature Anomaly คืออะไร?
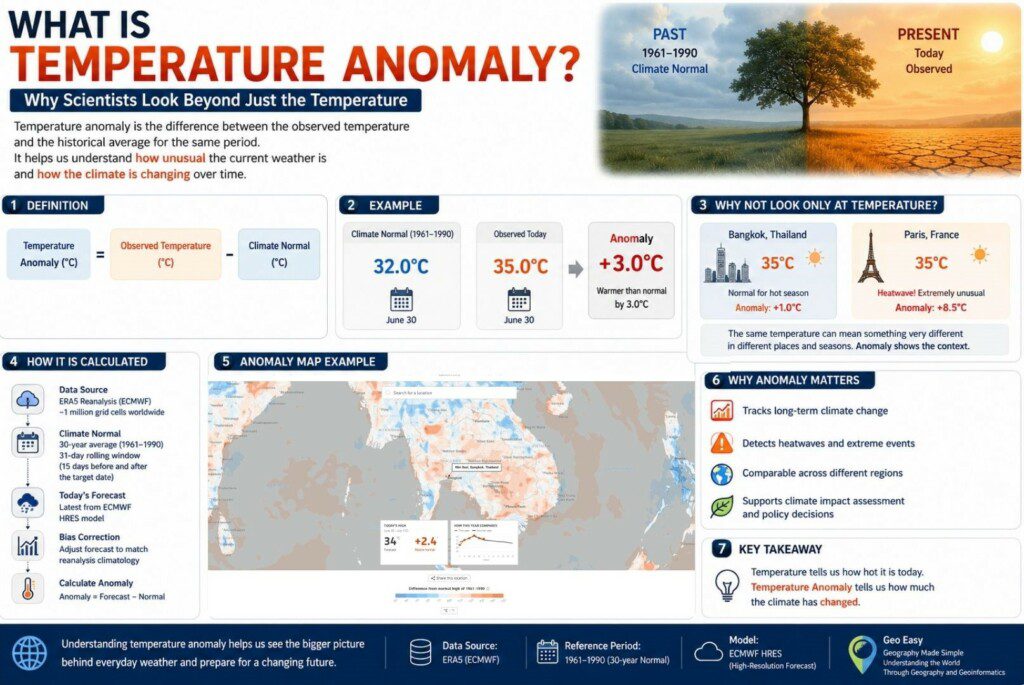
Temperature Anomaly คือ ความแตกต่างระหว่างอุณหภูมิที่ตรวจวัดได้ในปัจจุบัน กับค่าเฉลี่ยอุณหภูมิของช่วงเวลาเดียวกันในอดีต ซึ่งเรียกว่า Climate Normal
นักวิทยาศาสตร์ไม่ได้ถามเพียงว่า
วันนี้อุณหภูมิเท่าไร?
แต่ถามว่า
วันนี้สูงกว่าหรือต่ำกว่าค่าปกติกี่องศา?
ตัวอย่างเช่น
- ค่าเฉลี่ยอุณหภูมิสูงสุดของวันที่ 30 มิถุนายน = 32°C
- อุณหภูมิสูงสุดที่ตรวจวัดได้วันนี้ = 35°C
ดังนั้น:
35°C − 32°C = +3°C
หมายความว่า วันนี้ร้อนกว่าค่าเฉลี่ยในอดีต 3°C
📊 ทำไมจึงไม่ดูแค่อุณหภูมิ?
อุณหภูมิจริงเพียงอย่างเดียวอาจทำให้เข้าใจคลาดเคลื่อน เพราะแต่ละพื้นที่มีภูมิอากาศพื้นฐานแตกต่างกัน
ตัวอย่างเช่น
- กรุงเทพฯ 35°C ในฤดูร้อน อาจเป็นเรื่องปกติ
- เมืองในยุโรป 35°C อาจถือเป็นคลื่นความร้อนที่ผิดปกติอย่างมาก
ดังนั้น การเปรียบเทียบกับ “ค่าปกติของพื้นที่นั้น” จึงสะท้อนความผิดปกติของสภาพภูมิอากาศได้ดีกว่า
🛰️ Climate Normal คืออะไร?
Climate Normal คือค่าเฉลี่ยของข้อมูลภูมิอากาศระยะยาว โดยทั่วไปมักใช้ข้อมูลย้อนหลัง 30 ปี
ข้อมูลนี้ช่วยลดผลกระทบจากความผันผวนของสภาพอากาศในแต่ละปี และใช้เป็นฐานเปรียบเทียบว่าสภาพอากาศปัจจุบันแตกต่างจากอดีตมากน้อยเพียงใด
ตัวอย่างเช่น Reuters Climate Monitor ใช้ข้อมูล ERA5 Reanalysis และเปรียบเทียบกับค่าปกติช่วงปี 1961–1990
🗺️ Temperature Anomaly กับแผนที่ภูมิศาสตร์
ในระบบ GIS ค่า Temperature Anomaly สามารถคำนวณเป็นรายกริด แล้วนำเสนอเป็นแผนที่สี
โดยทั่วไป:
🔴 สีแดง = ร้อนกว่าปกติ
🔵 สีน้ำเงิน = เย็นกว่าปกติ
แผนที่ลักษณะนี้ช่วยให้นักวิทยาศาสตร์และประชาชนมองเห็นรูปแบบความผิดปกติของอุณหภูมิในระดับภูมิภาคและระดับโลกได้ชัดเจนขึ้น
🌏 เหตุใด Temperature Anomaly จึงสำคัญ?
Temperature Anomaly สำคัญเพราะช่วยเปรียบเทียบพื้นที่ที่มีภูมิอากาศต่างกันได้อย่างเป็นธรรม โดยใช้ค่าปกติของแต่ละพื้นที่เป็นฐาน
จึงช่วยให้สามารถ
- ติดตามแนวโน้มภาวะโลกร้อน
- วิเคราะห์คลื่นความร้อน
- ประเมินผลกระทบจากการเปลี่ยนแปลงสภาพภูมิอากาศ
- เปรียบเทียบข้อมูลระหว่างภูมิภาคต่าง ๆ ของโลก
🎯 บทสรุป
อุณหภูมิรายวันบอกว่า “วันนี้ร้อนแค่ไหน”
แต่ Temperature Anomaly บอกว่า “วันนี้แตกต่างจากสิ่งที่เคยเป็นมากเพียงใด”
ด้วยเหตุนี้ นักภูมิศาสตร์และนักภูมิอากาศวิทยาจึงให้ความสำคัญกับ Temperature Anomaly เพราะเป็นตัวชี้วัดที่สะท้อนการเปลี่ยนแปลงของระบบภูมิอากาศโลกได้ชัดเจนกว่าการดูอุณหภูมิเพียงอย่างเดียว
“อุณหภูมิ” บอกว่าวันนี้ร้อนแค่ไหน แต่ “Temperature Anomaly” บอกว่าโลกกำลังเปลี่ยนไปมากเพียงใด
Geo Easy : ภูมิศาสตร์ ง่ายนิดเดียว
เรียนรู้โลก เข้าใจพื้นที่ ด้วยภูมิศาสตร์และภูมิสารสนเทศ







ความคิดเห็น